

A Better Way To Estimate Battery Lifetime
We deploy batteries in many different environments. How long can we expect those batteries to last, and what measures should we take to increase their lifetime? And after we’ve deployed them, how can we monitor the health of our batteries relative to an expected degradation curve?
To answer both of these questions, we developed a new tool to produce estimates of battery lifetime in any environment temperature and usage pattern. With this tool, we can better understand the tradeoffs involved in deploying batteries under a range of conditions. We can then leverage this understanding to monitor the health of our batteries relative to a baseline. In this blog, we’ll explore the motivation behind developing this tool, as well as the research used to inform the model. We’ll wrap it up by putting the tool to use: to make a recommendation on how our batteries should be stored in the field.
What’s The Problem With A Manufacturer’s Rating?
Typically, a manufacturer’s rating will tell us what to expect from a battery in terms of its lifetime usage – for example, 3000 cycles at 80% depth of discharge (DoD) until end-of-life. However, this only specifies the number of cycles we can expect under ideal operating conditions. For practical applications, we want to know how long we can expect a battery to last considering all aging effects from both cycle aging and calendar aging, over a range of operating conditions. In our last blog post on battery lifetime , we discovered that for LFP batteries, the most impactful variable is the environment temperature (link here – if some of the terms in this blog are confusing, you can find more background in this post). But still, we struggled to make estimates regarding battery lifetime in different conditions because the evidence from the literature is sparse and often conflicting.
Thus, we set out to develop a model of both calendar aging and cycle aging for LFP cells, and then to combine those models in order to produce a total aging curve.
Notes:
- For more research justifying the models used in this post, see the appendix. We kept the research discussion brief in the main blog in order to keep the focus on the lifetime estimation tool and what we can do with it.
- Additionally, all of the figures in this post showing expected battery lifetime in number of days were produced using the lifetime estimation tool we developed.
Cycle Aging Modelled With Temperature
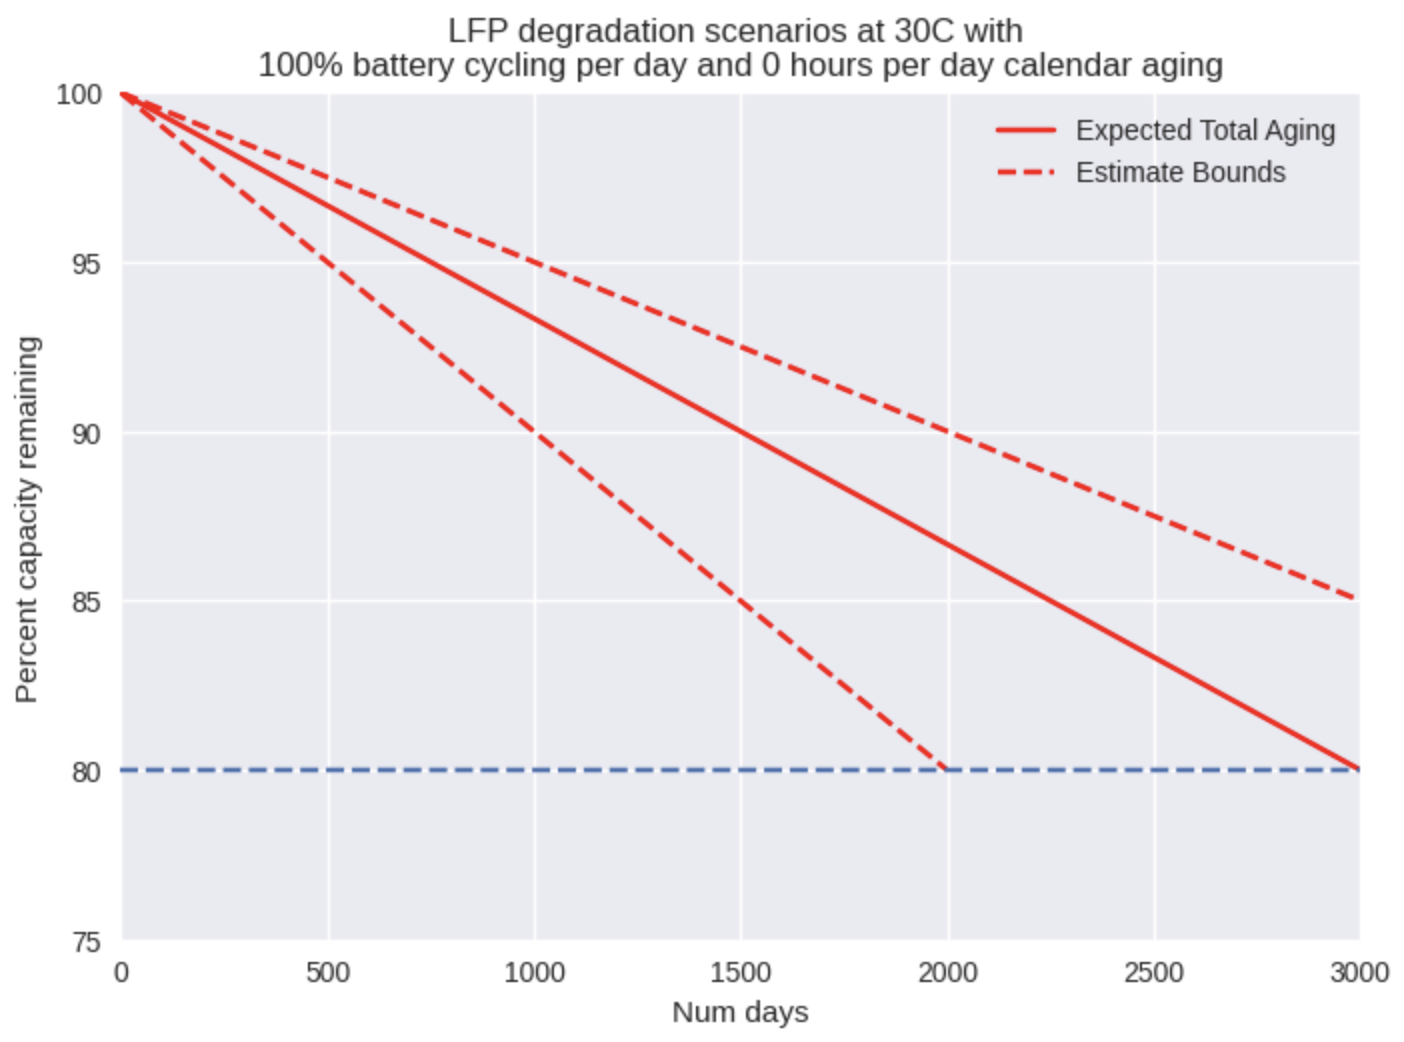
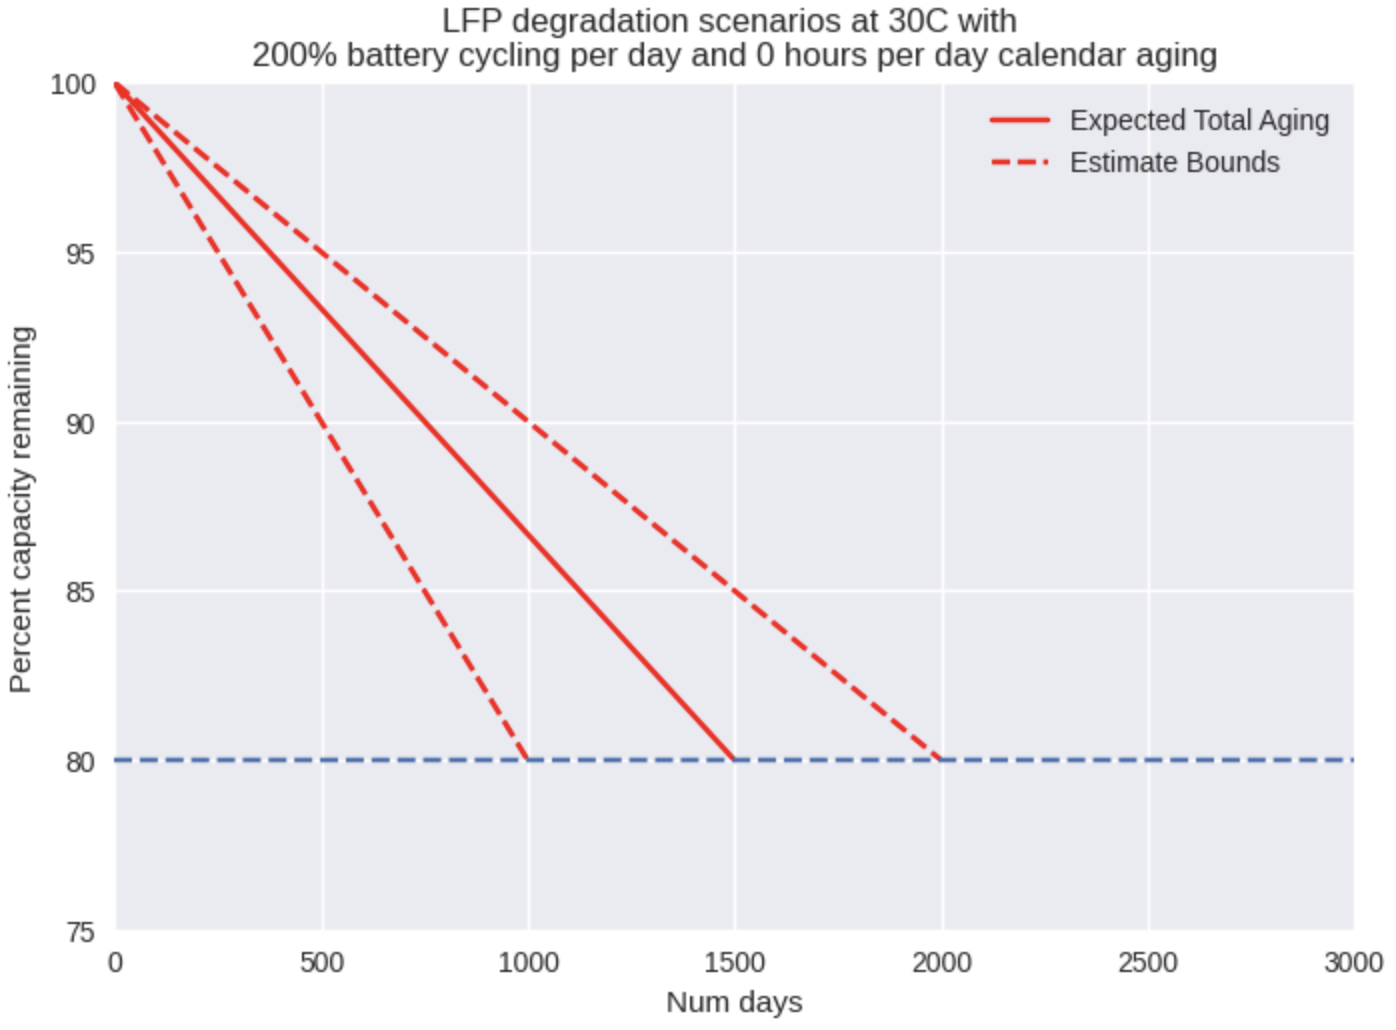
As we can see from Fig. 1, we have modelled cycle aging as a simple line from 100% of nominal capacity down to 80% capacity (typical end-of-life figure for commercial batteries) at the number of rated cycles we expect. The resulting output is shown in number of days rather than cycles because time is the more important output here – how long after installation will these batteries need to be replaced? So if we change the cycle input from 1 to 2 full cycles per day, then we see the number of days of lifetime is reduced by half. Note that this still assumes that the battery is never in a calendar aging condition.
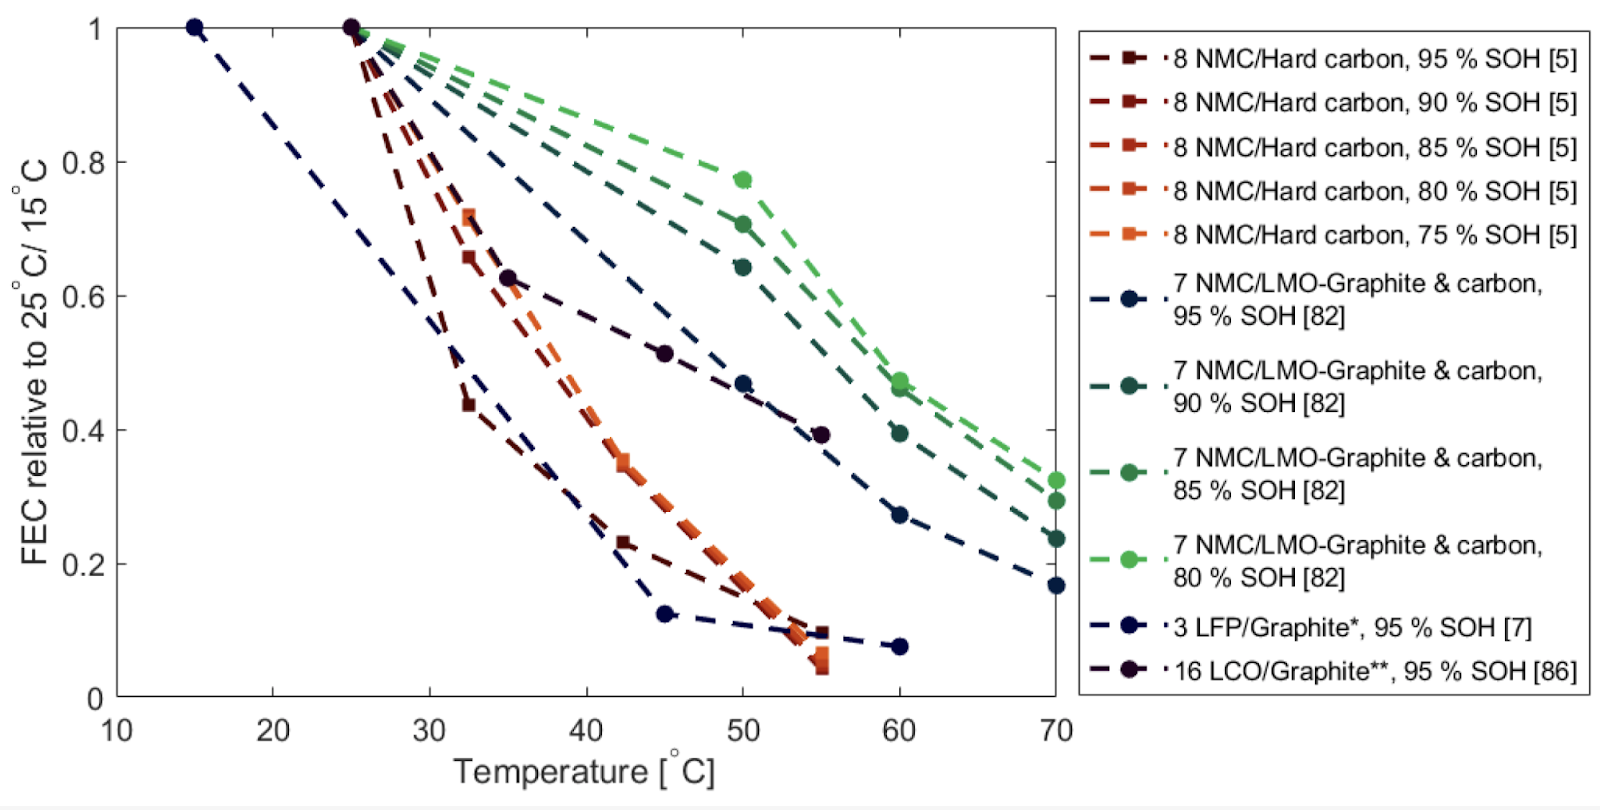
In a comprehensive literature survey [1], Spitthoff et. al. demonstrate that the rate of cycle aging for LFP cells has little dependence on DoD and discharge rate but has a high dependence on temperature. As a result, we have only included a temperature dependency in our model of cycle aging. The effects of temperature were gathered from this same study, with the crucial figure shown below:
Putting everything together for cycle aging, we can now generate lifetime estimates for any temperature and number of cycles per day. As you can see in the figure below, the estimate bounds are massive as a result of the uncertainty in the literature. Nevertheless, it proves useful to visualize the expected range of behavior from a battery in a specific set of conditions. If we can aim to hit our targets even in a pessimistic scenario, then we put ourselves in a position to succeed.
Calendar Aging Modelled With Temperature
In order to model calendar aging, we combined the results from several different studies into an understanding of pessimistic, standard, and optimistic scenarios. We have modeled the percent capacity loss as a simple power law relationship with time, where the coefficient of the function decays exponentially as temperature increases. This is an adaptation of the model proposed by Krupp et. al. [2], in order to make a more straightforward fit to the data of interest.
We decided not to model the effects of SoC level on calendar aging rate because Hassem et. al. showed that calendar aging at 65% and 100% SoC yield similar results [3], and moreover, we always expect our battery to be near 100% SoC when in open circuit condition. An example of this model is shown below, with the battery left in open circuit condition for the entirety of the simulation.
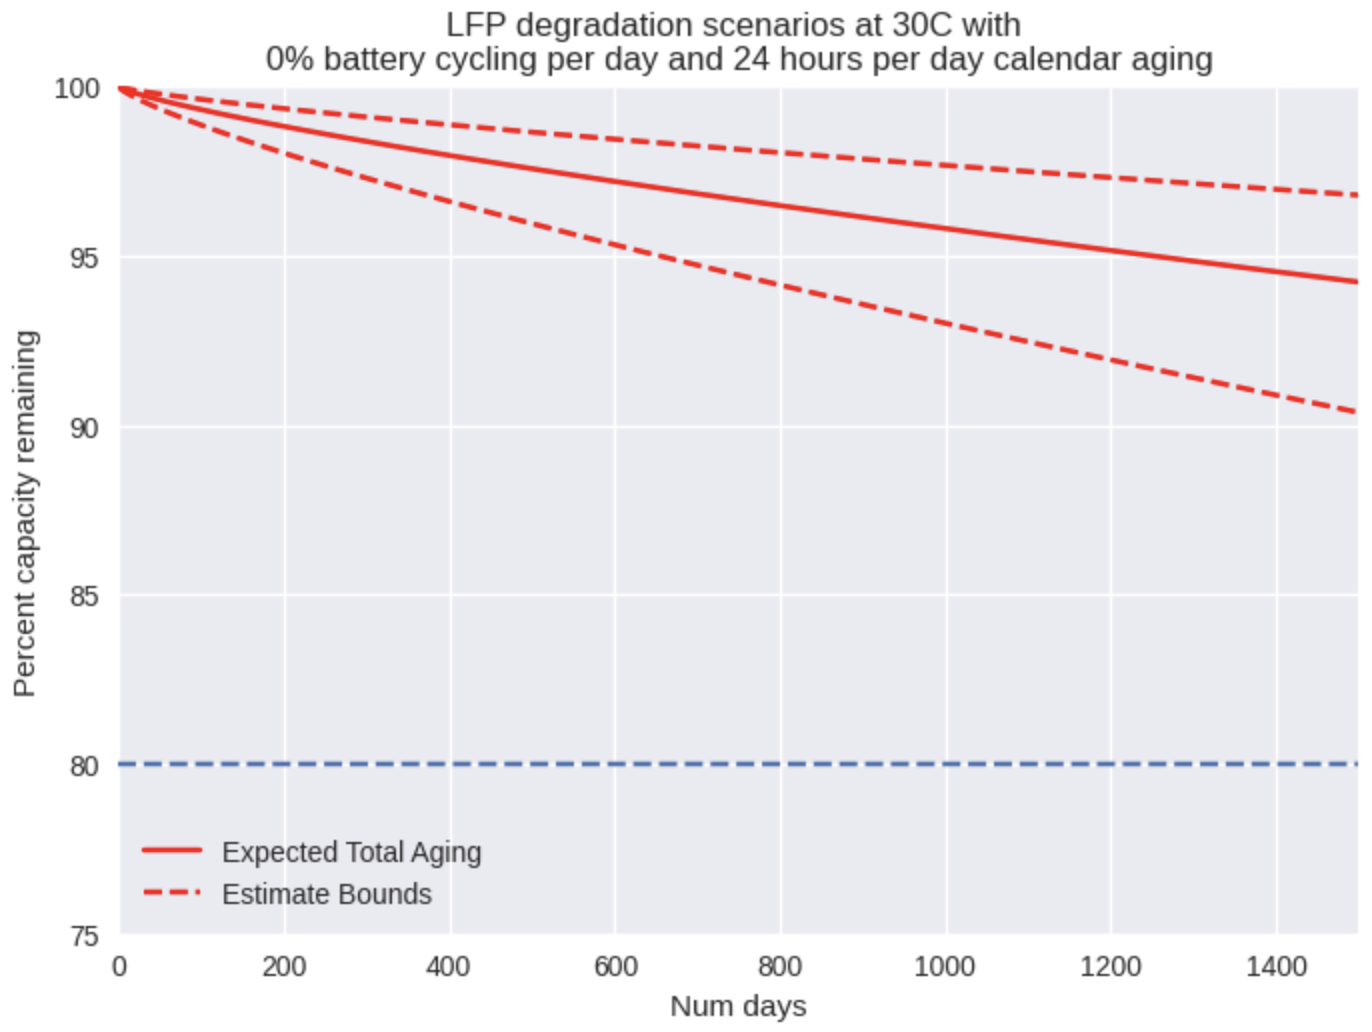
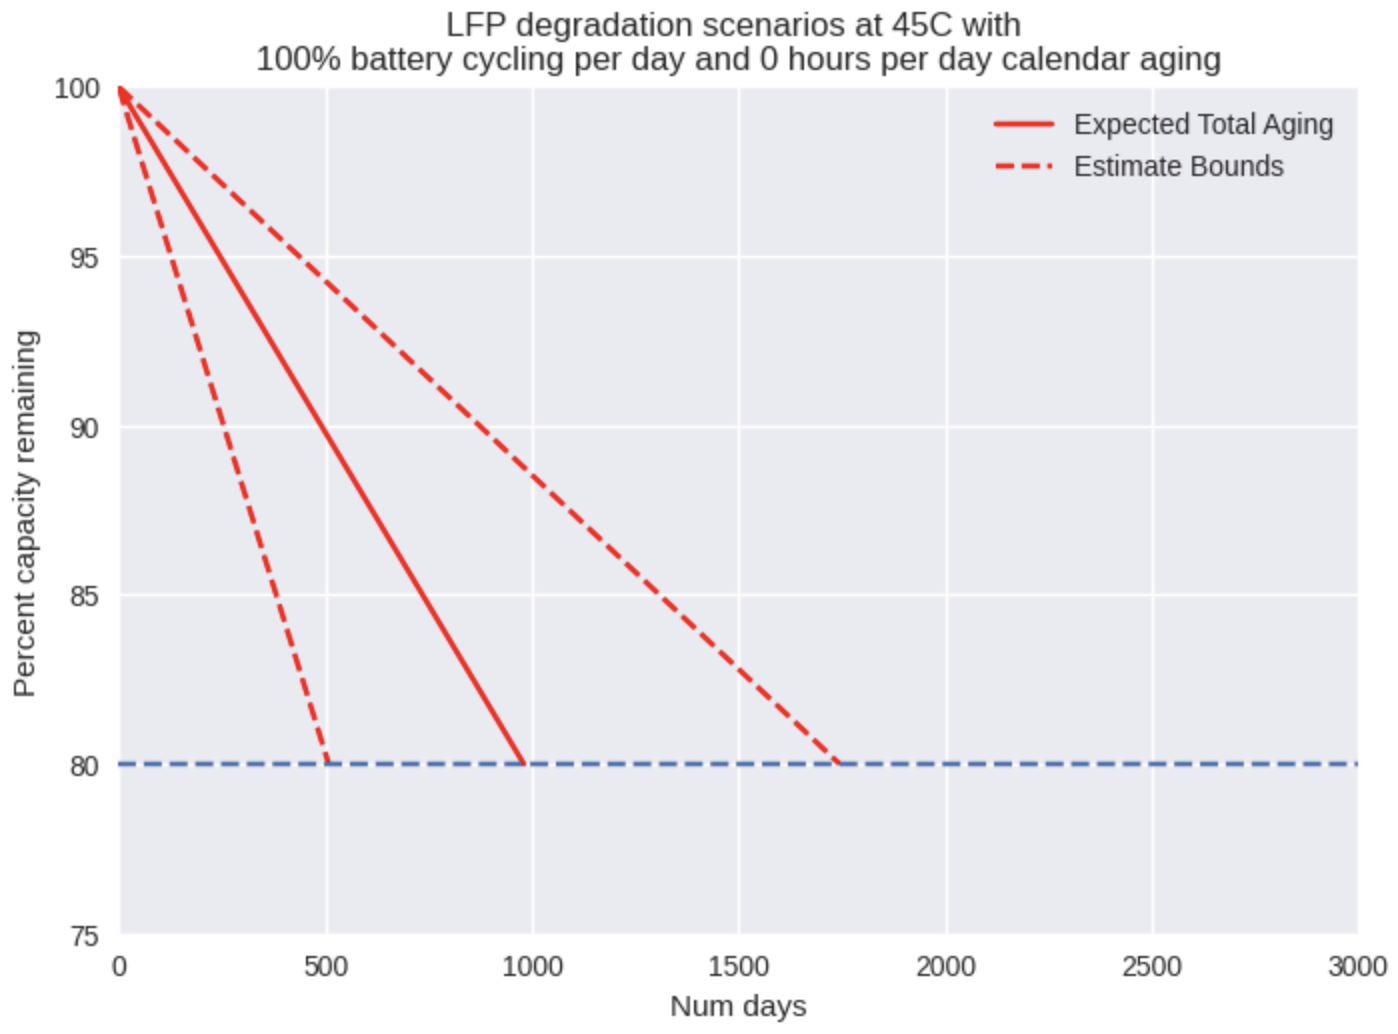
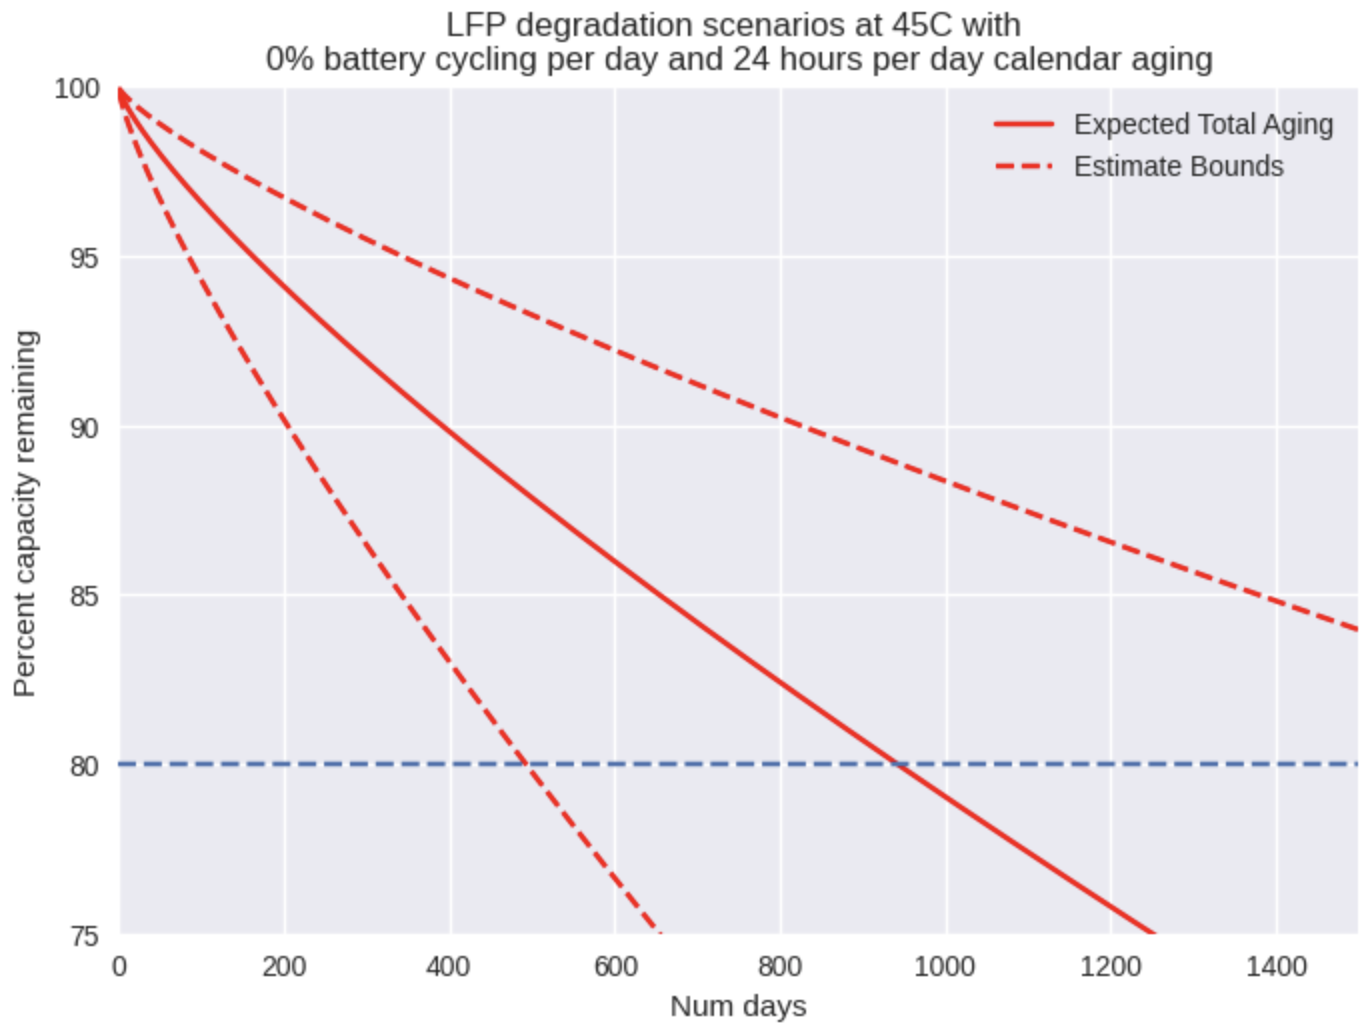
Just as we observed with cycle aging, the rate of calendar aging is strongly affected by the temperature of the environment. If we increase the temperature to 45C, the effects of calendar aging become prominent and in fact could end a battery’s life after around just 1000 days of storage! This has massive ramifications for supply chain and deployment strategy. Storing batteries in hot warehouses or enclosures without sufficient cooling must be avoided at all costs in order to achieve a full life from the battery.
Putting It All Together – Using The Tool To Support Design Decisions
Now, let’s run through an example of how we can use this tool to help us make more informed design decisions. At Okra, we have been exploring a hardware enclosure that contains everything needed to energize a household. One question we wanted to answer is: does it make sense to house the battery in this enclosure? And if we do, how much cooling do we need to provide?
In order to compare a fan and no-fan scenario, we ran simulations at two different temperatures (35C and 45C) with worst-case use conditions – 70% of a full cycle through the battery every single day and 8 hours of calendar aging per day, all at an average ambient temperature of 30C. We assume that the fan should keep the inside temperature within 5 degrees of the ambient, which would be 35C on average. The results are shown below.
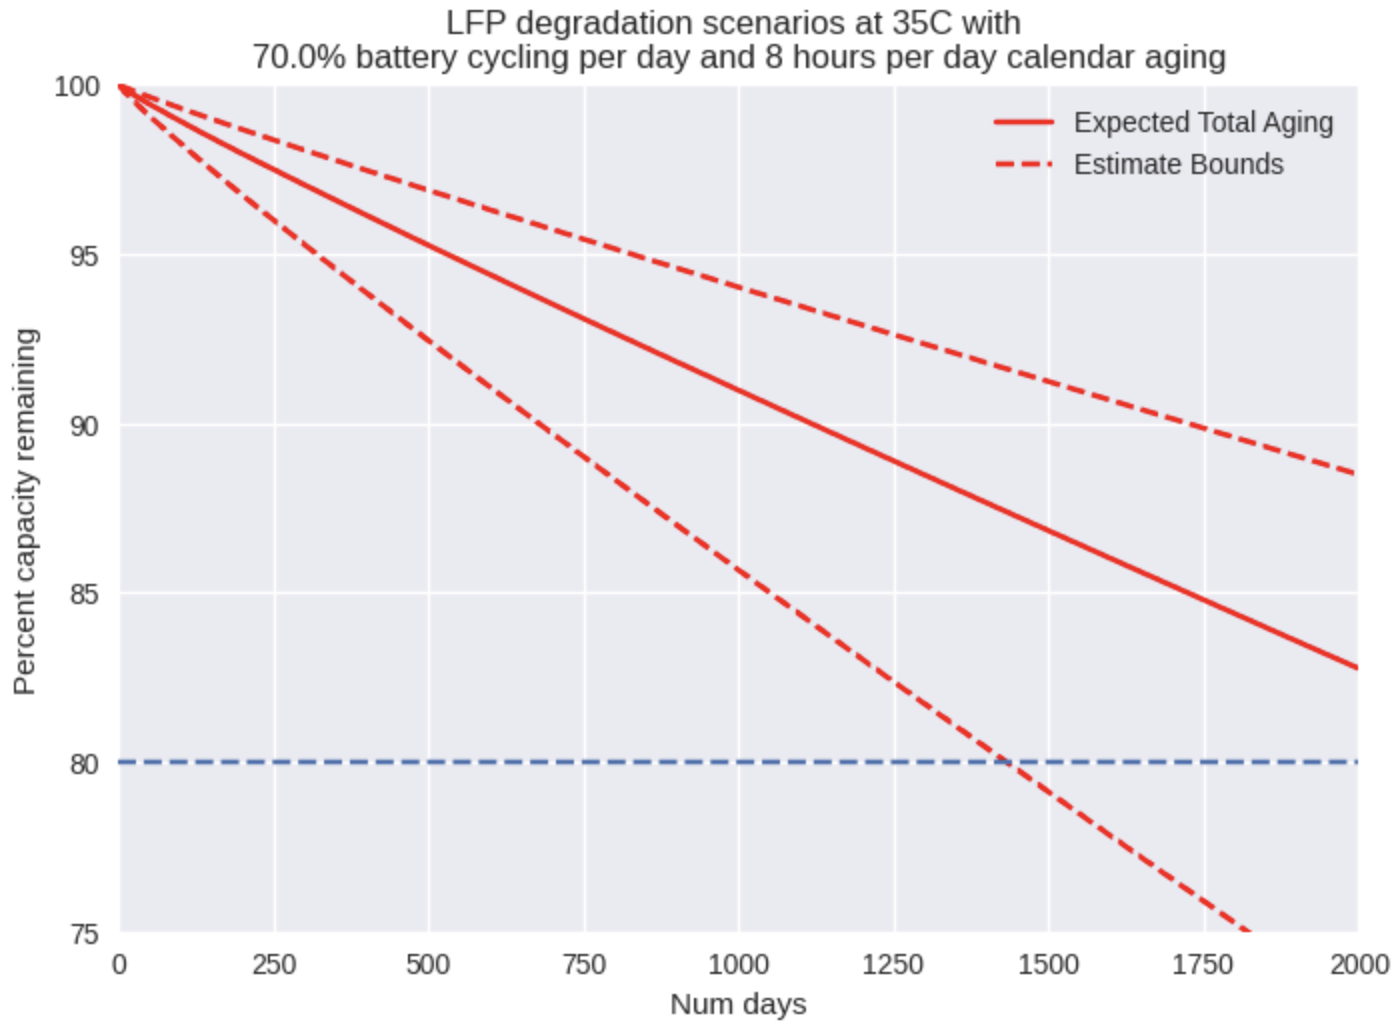
We are targeting a battery lifetime of 5 years (1825 days) at a minimum. At 35C, we are in the right neighborhood, as the pessimistic estimate suggests about 4 years to end-of-life while the standard estimate yields over 6 years.
For the next test, we assumed that temperature may rise to 45C or higher without any form of cooling.
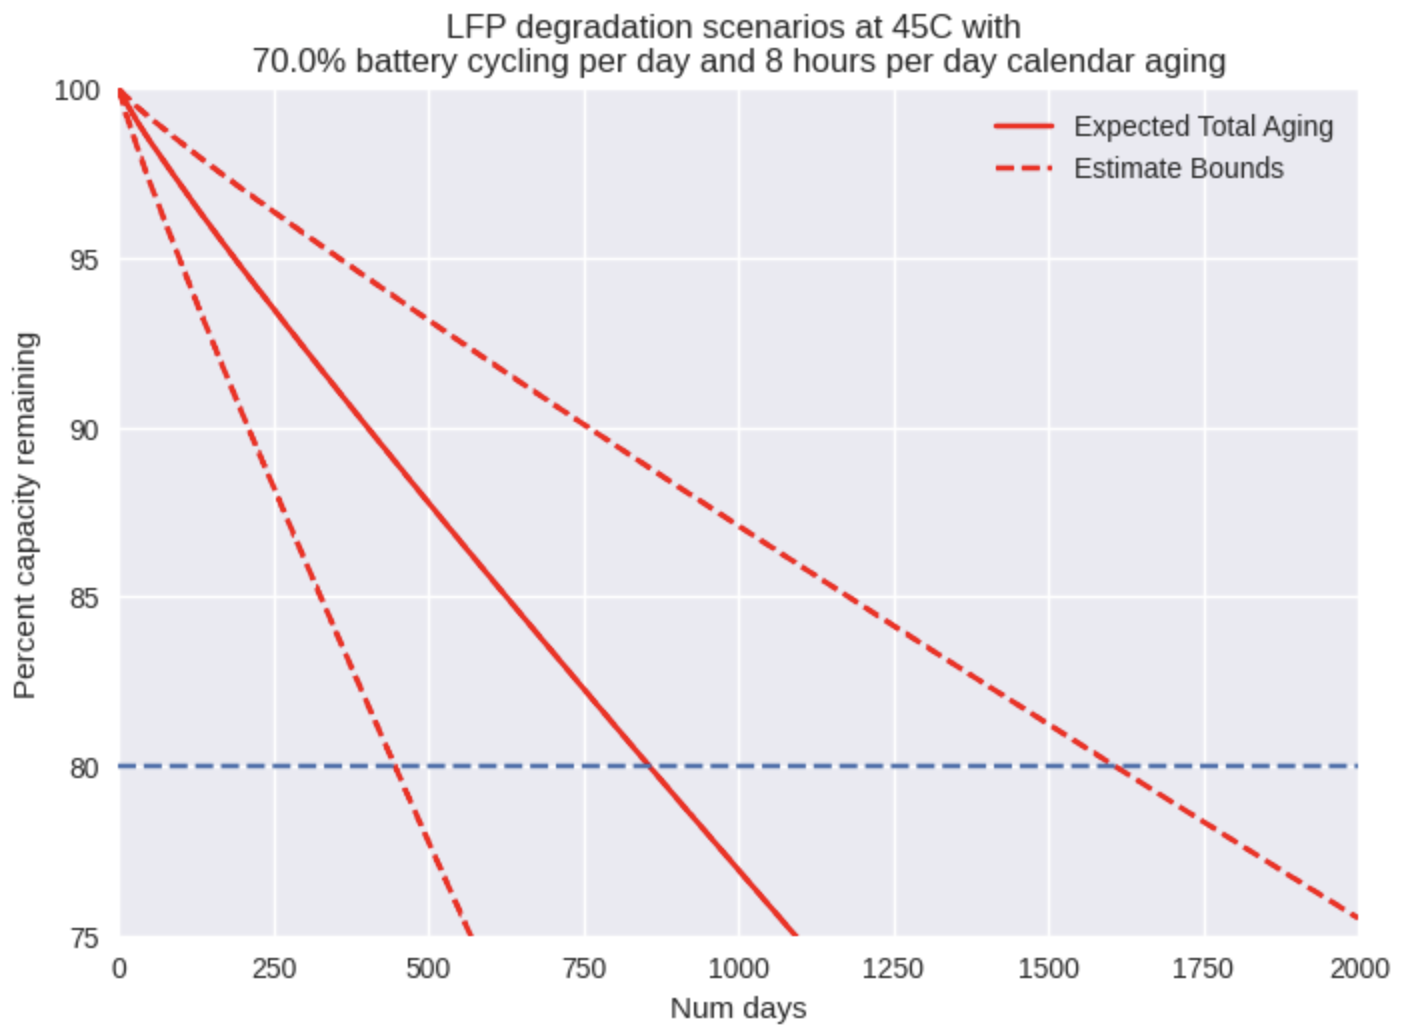
At 45C, even the standard estimate falls short of 2.5 years to end-of-life, so we would need at least one battery replacement in order to reach 5 years of operating life. If we say adding a fan to the enclosure costs about $5, and the cost of replacing an LFP pack is generously estimated at $150/kWh [6], then for residential scale battery packs, the choice is clear – keeping the temperature inside the enclosure near ambient is essential. Even for a relatively small (for a household) 12V/50Ah LFP battery (0.64kWh capacity), the comparison is:
- $5 to add a fan to the enclosure
- $96 to replace the battery after 2.5 years
And in the long term, things will only get worse, as the battery replacements will recur every couple of years thereafter.
In order to generalize the recommendations, we can say:
- If an LFP battery will face hot temperatures (~35C or greater), then we recommend cooling the battery in order to prevent rapid degradation.
- Depending on the application and type of enclosure the battery is contained in, the form of cooling may vary. In our case, a fan may be sufficient to keep the battery close to ambient temperature, while in an electric vehicle, liquid cooling between the individual cells may be required in order to keep temperatures low.
Even though the uncertainty on the lifetime estimates is large, the ability to simulate battery lifetime in a range of different operating conditions empowers us to make design decisions grounded in research. Depending on the decision context, we can decide whether to put more stock in the worst-case, expected, or best-case scenario.
Going Forward – Monitoring Batteries Relative To A Baseline
In the future, we will leverage this tool to help us monitor the state of health of our deployed batteries. Thus far, we have been able to estimate the lost capacity of our batteries, but we have been unable to cross-check this data with an expected rate of degradation. By comparing the rate of degradation we see in the field with the expected rate of degradation generated from our model, we will be able to understand when our batteries are demonstrating concerning behavior, and when they are simply running the course of their life. Already, we have a few great examples to investigate, as several of our testing systems underwent coincidental accelerated life cycle testing when they were mounted in a hot shed.
Access To The Tool And Feedback
Feel free to check out the tool yourself here and try it out!
This is just one guy’s attempt to make something useful, so if you can help us make it even better, we would love to hear from you – click here to give feedback. We hope to continue improving the accuracy of this tool by updating it as new research comes out and as we learn more from our own work.
Appendix
Calendar Aging Assumptions
Below are the results from two different calendar aging studies on LFP cells. Numbers have been approximated from figures where they have not been provided precisely.
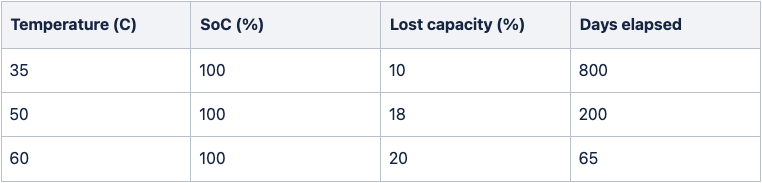
Waterloo study [4]:
HAL study [3]:
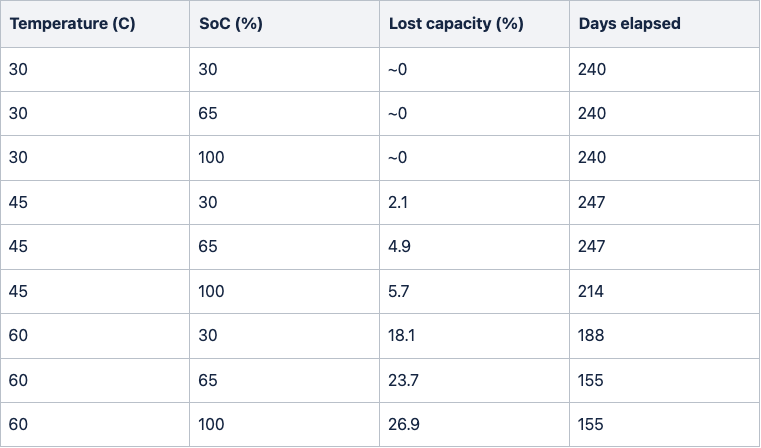
From these results, we based our pessimistic scenario on the Waterloo study and our standard scenario on the HAL study. The reason for this is that the Waterloo study showed much faster calendar aging than other literature sources and was done on pouch cells (which may age more quickly), and the HAL study seems to be more in alignment with other sources from the literature.
When we compare the results from the different scenarios of our simulation with the two studies above, we see that they line up closely.
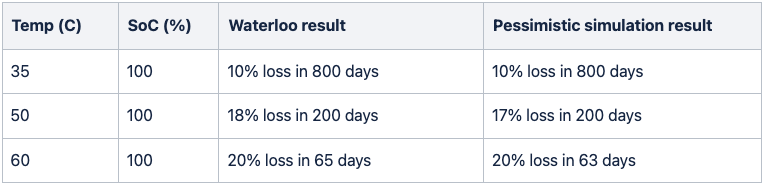
Pessimistic calendar aging scenario compared with Waterloo study results:
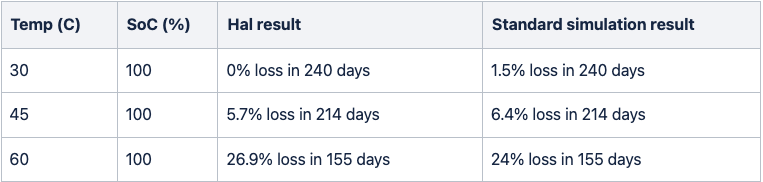
Standard calendar aging scenario compared with HAL study results:
Cycle Aging Assumptions
Note on the shape of the curve: We have modelled the cycle aging curve at a constant rate for simplicity. According to the literature, the rate of cycle aging seems to go through an S-curve with a faster initial period of degradation followed by a slow down and then another increase in degradation (knee point) after 10-20% of cell capacity has already been lost. However, there is so much variation in the shape of this trajectory in the literature that it seems perhaps imprudent to attempt to model, considering that in most cases the overall trend is very close to linear, at least until end-of-life.
Aside from this, there are two main assumptions that make up the cycle aging model:
- How many cycles do we expect to see at 30C?
- How much will that number of cycles reduce as the temperature increases above 30C?
On the first point, Yuliya et. al. highlight a range of possible scenarios [5]. For example, even at 35C, they show results of well over 3000 cycles to end-of-life. However, there are other examples they cite that seem to indicate a lifetime closer to 2000 cycles at 35C, or closer to 3000 cycles at 25C. In order to cover the range of cycles expected around the 30C mark, we developed a simple rule of thumb that seemed to capture the trend. At 30C, a pessimistic lifetime estimate is 2000 cycles, a standard lifetime estimate is 3000 cycles, and an optimistic lifetime estimate is 4000 cycles.
For temperature dependence, we based our approach on the evidence shown in Fig. 3. According to this figure, the LFP cell has a stronger dependence on temperature than other chemistries. While the other cells exhibit a roughly linear dependence on temperature, the data here suggests that the LFP cell’s lifetime declines much more rapidly in the range from 15C to 45C than between 45C and 60C. Based on the few data points for LFP in this figure as well as the roughly linear overall relationship seen for other cell types, I remain skeptical of the extrapolation made here, and this uncertainty has been included in the pessimistic to optimistic range of our model. The optimistic end of the model anticipates a more linear relationship with temperature, while the pessimistic estimate attempts to replicate the figure.
With cycle life, we were not able to simply cross-check our estimates with studies because we were unable to find such clear test matrices of cycle life over temperature as we were able to find for calendar aging. Therefore, we don’t know for sure that this model holds up empirically, but we have attempted to model the behavior the best that we can with the literature available.
Sources
[1]: Temperature, Ageing and Thermal Management of Lithium-Ion Batteries
[2]: Calendar aging model for lithium-ion batteries considering the influence of cell characterization
[3]: Calendar aging of a graphite/LiFePO4 cell
[4]: Calendar Aging and Lifetimes of LiFePO4 Batteries and Considerations for Repurposing
[5]: Degradation of Commercial Lithium-Ion Cells as a Function of Chemistry and Cycling Conditions
[6]: The EV battery chemistry debate just got more complicated

